As global developers of renewable energy systems, we closely analyze regional energy transitions. The question, "how much of California's energy is renewable," is central to this, as the state is one of the largest and most complex energy markets in the world.
To provide a precise, technical answer, we must first clarify the query. "Energy" is a broad term. The query is most often a stand-in for electricity generation, not total energy consumption (which includes the fossil-fuel-heavy sectors of transport and building heat).
Focusing on electricity, the answer is complex but definitive. According to the most recent data from the U.S. Energy Information Administration (EIA) for 2023, approximately 51% of California's total in-state electricity generation came from non-fossil fuel sources.
This "non-fossil fuel" category is itself a composite, which we will break down. The state's own Renewable Portfolio Standard (RPS), which has slightly different rules, showed that 69% of retail electricity sales in 2022 came from RPS-eligible sources.
For the semi-experienced enthusiast, understanding this data requires looking at the individual components.
The Core Data: Deconstructing California's Electricity Mix
California's 51% non-fossil fuel generation (2023 EIA data) is a combination of its RPS-eligible renewables and its other zero-carbon sources (primarily large hydropower and nuclear).
RPS-Eligible Renewables: Approximately 36% of total generation.
Large-Scale Hydropower: Approximately 8% of total generation.
Nuclear Power: Approximately 7% of total generation (from the single remaining plant, Diablo Canyon).
From our professional perspective, the key takeaway is that over half of all electricity generated within California no longer comes from fossil fuels. This is a remarkable achievement for an economy of its scale.
The 36% from RPS-eligible renewables is where California's specific strategy becomes clear. It is a portfolio dominated by solar, supported by geothermal, wind, and biomass.
Solar is the undisputed leader in California's portfolio. This includes both utility-scale photovoltaic (PV) plants (massive solar farms, many of which we specialize in) and distributed generation (rooftop solar). California's abundant solar irradiance, particularly in the Mojave Desert, makes it one of the most effective places in the world for PV. This massive build-out of solar is the primary driver behind the state's renewable statistics.
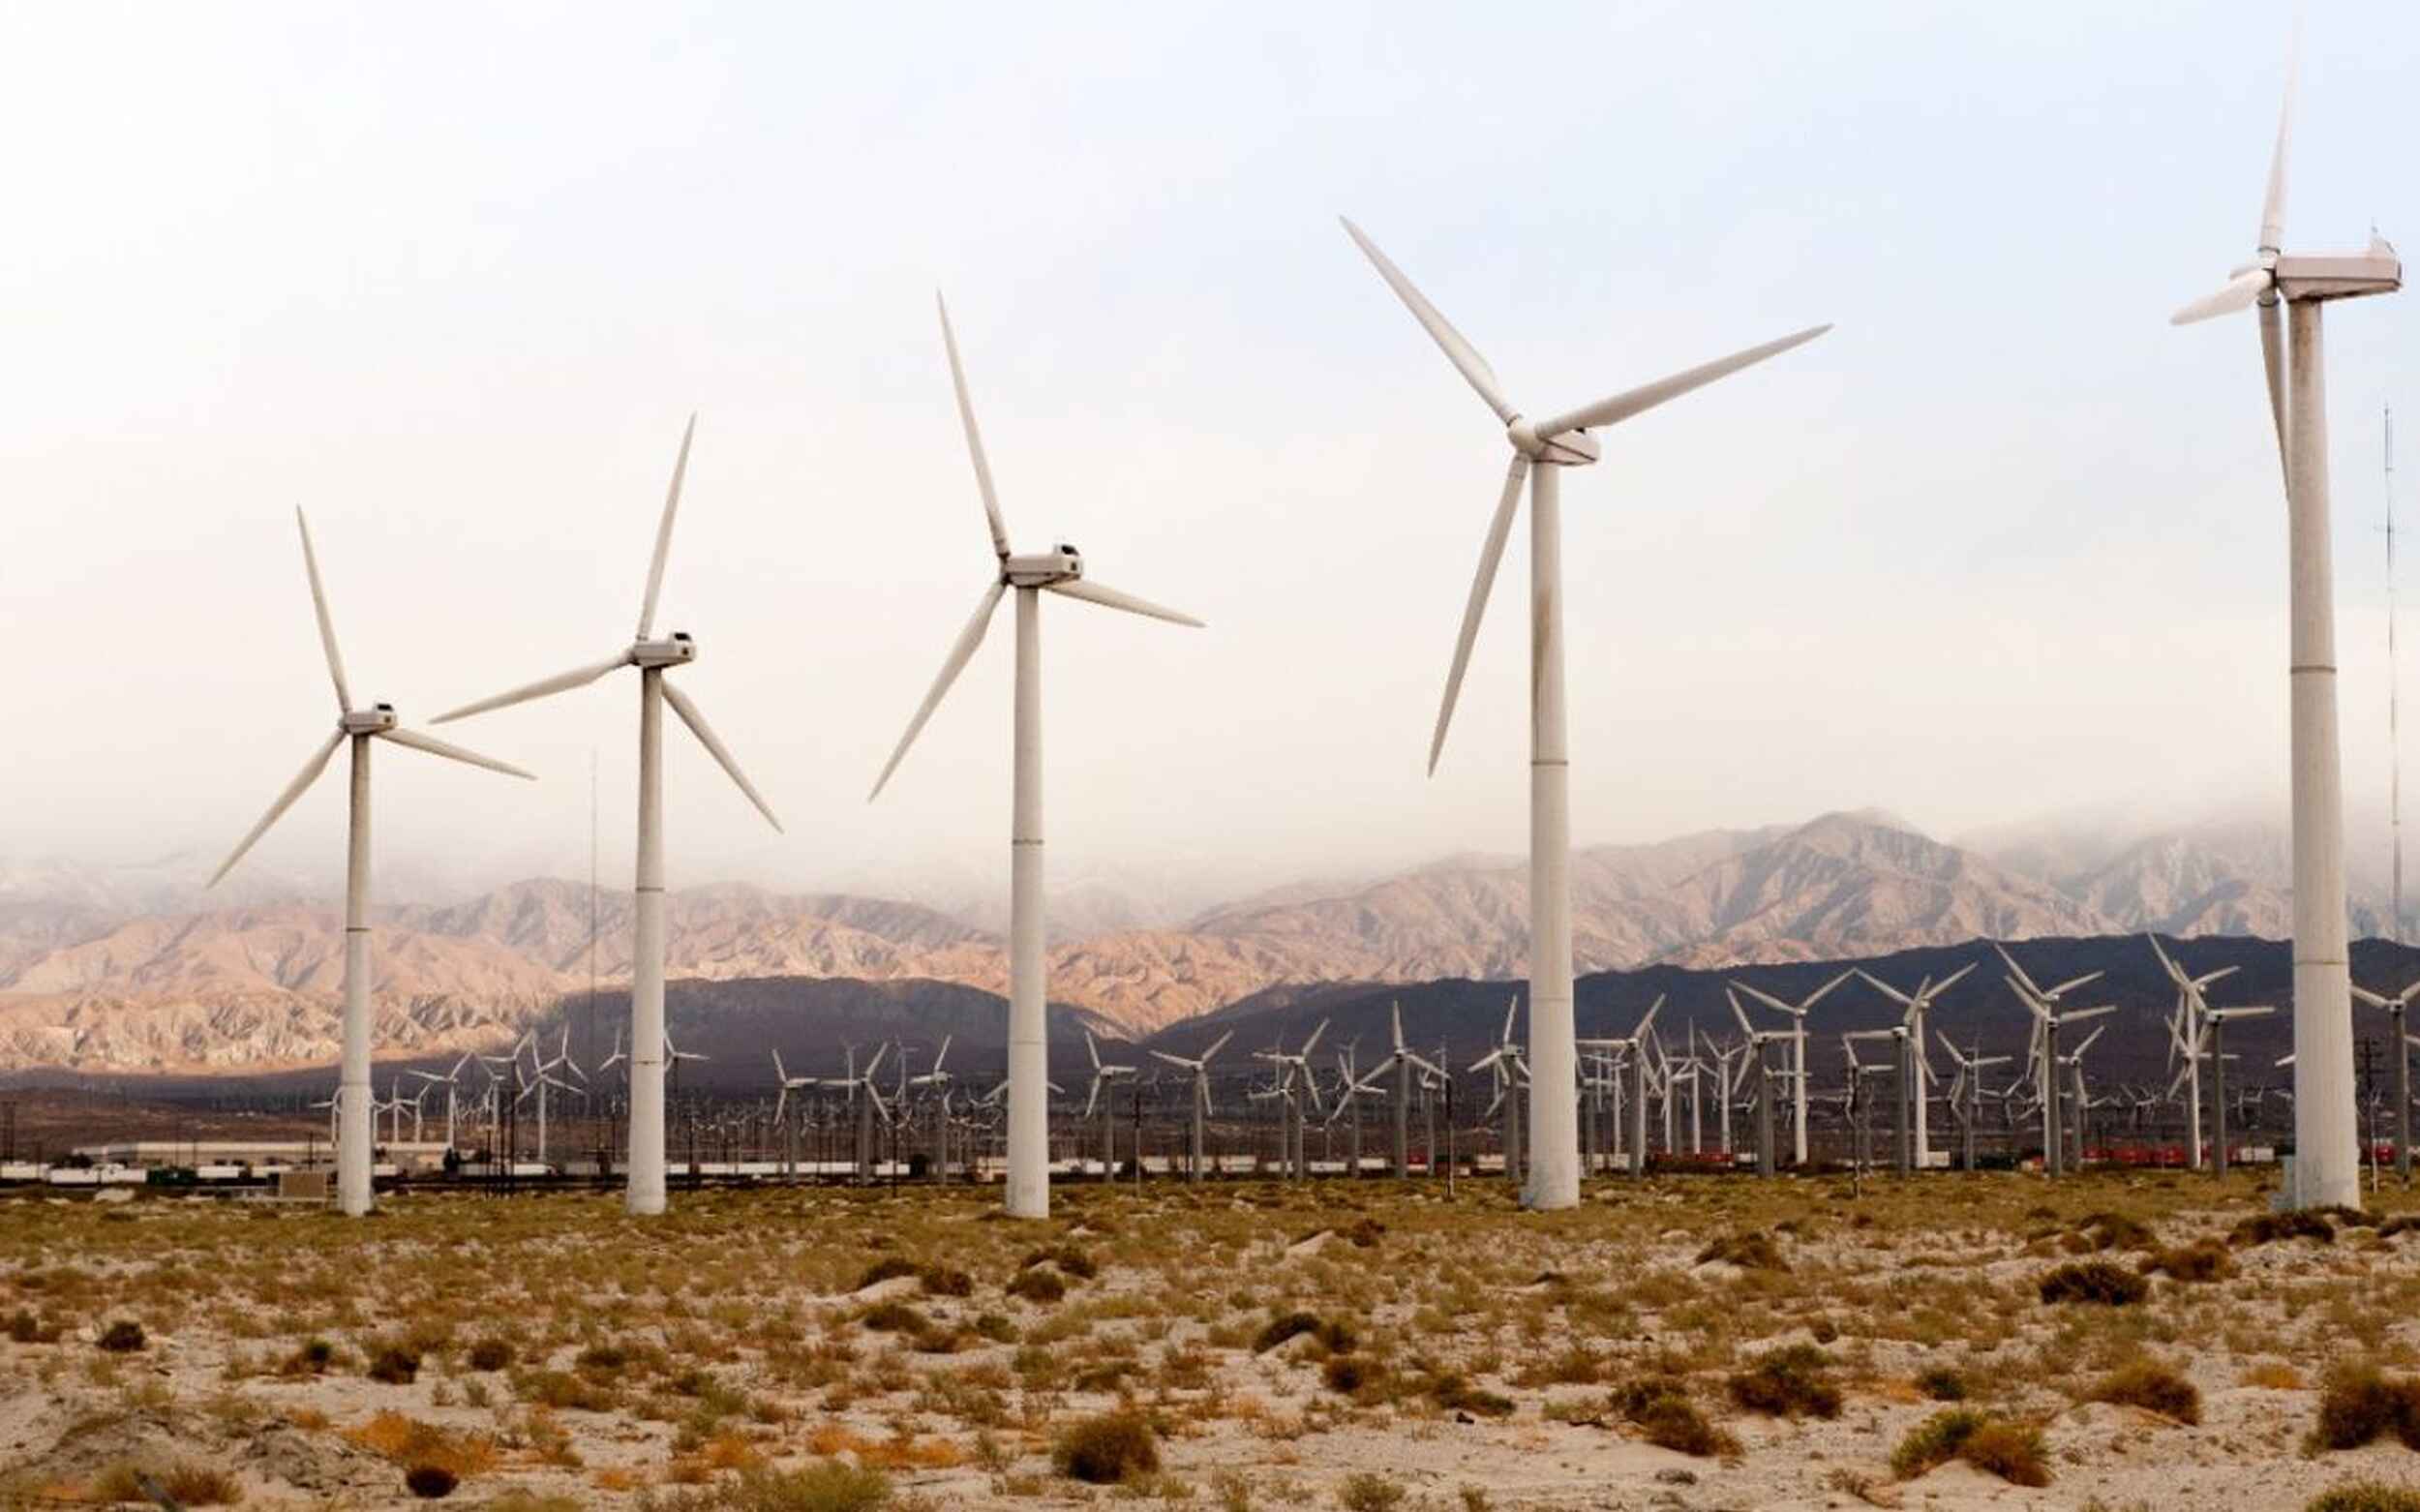
Unlike the variable nature of solar, geothermal power provides consistent, 24/7 "baseload" renewable energy. California is home to "The Geysers," the largest complex of geothermal power plants in the world. Wind power, concentrated in areas like the Tehachapi Pass and Altamont Pass, also provides a significant (though variable) contribution, often complementing the solar generation profile by producing power at different times.
Hydropower is California's legacy clean energy source. However, its output is entirely dependent on annual precipitation and snowpack. In severe drought years, generation from large-scale hydro dams plummets, requiring the grid to compensate with other sources (often natural gas). In wet years, it provides a massive surplus of clean electricity. This variability is a key challenge for grid planners.
The "Duck Curve" and the Rise of Battery Storage
From a technical standpoint, the most interesting story in California is not just the amount of renewables, but their integration. The high penetration of solar has created a famous grid challenge known as the "Duck Curve."
This phenomenon describes a typical day on the California grid:
1. Midday: Solar farms produce a massive surplus of electricity, pushing net demand on the grid very low.
2. Evening: As the sun sets, this solar generation vanishes. Simultaneously, residential demand spikes as people return home.
This creates a dangerously steep "ramp" in demand that traditional power plants must meet. From our expert view, this is where Battery Energy Storage Systems (BESS), a core Green Enesys expertise, have become the lynchpin of the state's entire strategy. Utility-scale batteries are being deployed at a record pace to solve this exact problem: they charge using the excess, low-cost solar energy midday and then discharge that stored energy during the high-demand evening ramp, stabilizing the grid.
Our Expert Conclusion
To answer the query directly: Renewable energy accounts for a dominant share of California's electricity. As of 2023, over 51% of in-state generation comes from non-fossil fuel sources, with RPS-eligible renewables (led by solar) making up ~36% of that.
From our perspective, California is no longer just a model for deploying renewables; it is now the world's foremost laboratory for integrating them at scale, with battery storage acting as the critical enabling technology.
Resources
U.S. Energy Information Administration (EIA) - California Profile: https://www.eia.gov/state/?sid=CACalifornia Energy Commission (CEC) - RPS Program: https://www.energy.ca.gov/programs-and-topics/programs/renewable-portfolio-standardCAISO (California Independent System Operator) - Today's Outlook: https://www.caiso.com/TodaysOutlook/Pages/default.aspx
